Does climate change affect your health? Short answer — yes | Public
Published 2:30 pm Wednesday, February 21, 2024


The following was originally published by Public Health Insider, the official blog for Public Health — Seattle & King County, and edited by Courier-Herald Editor Ray Miller-Still:
Did you know climate change could be making your asthma worse? That it’s making allergy season longer? That more people risk getting sick or dying as summer temperatures get hotter?
2023 brought us the hottest summer on record globally, making more people aware of climate change and its impact on our environment. However, not many people know about the impact climate change can have on our health.
To help bring awareness and inform future actions, Public Health – Seattle & King County has launched a new set of data dashboards that explore some of the impacts of climate change on the health of King County residents.
In the Pacific Northwest, climate change is leading to longer, hotter summers and more intense wildfire seasons. These weather events have a wide range of impacts on our health, both short-term and long-term. They can cause heart and lung problems, heat stroke, and even lead to mental health distress, among other things. They can also put stress on our healthcare system as emergency department visits and 911 calls increase.
Gathering information on these health impacts in our community will allow us to understand trends over time, identify disparities in who is most impacted, establish potential areas for action, and inform future planning and investment.
Note that these dashboards provide a sample of how climate impacts our health. They are not a complete representation of the many health risks caused by climate change.
You can explore the data indicators we are tracking and how they relate to climate change at publichealthinsider.com. Dashboard information includes heat- and cold-related illnesses, asthma, seasonal allergies, food and waterborne illnesses, and vector-borne diseases.
WHERE DISPARITIES EMERGE
Climate change can worsen many health inequities already present in our society, as communities of color and low-income households tend to be impacted the most. This is due to many factors such as where people live, the work they do, and the healthcare resources they have access to – all things influenced by structural and environmental racism. Older adults, children, pregnant people, and people with certain medical conditions like asthma, diabetes, and heart disease are also particularly vulnerable to the health impacts of climate change.
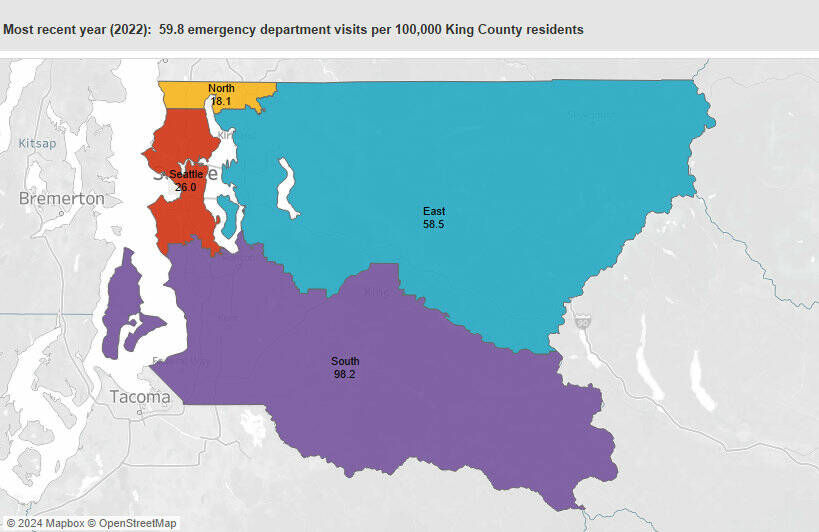
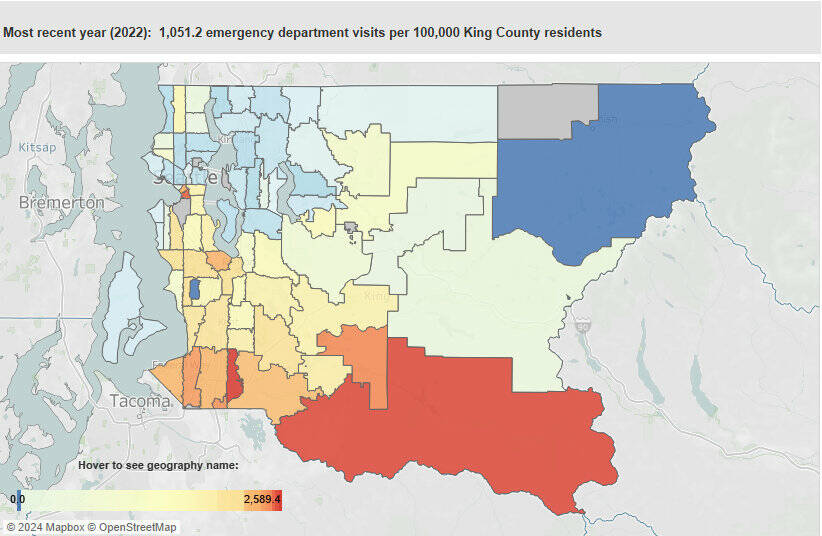
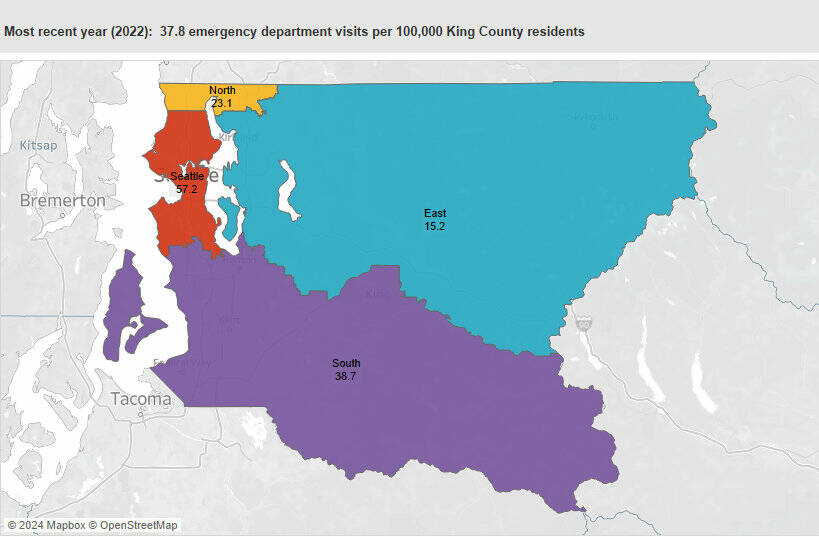
A first look at the dashboards shows some disparities emerging from the data. For example, when breaking down by age, older adults (ages 75+) were the most likely to visit the emergency department (ED) for heat-related and cold-related illness in the past few years. This group is more sensitive to heat due to age, chronic illness, or medications they may be taking.
When looking by race and ethnicity, the rate of ED visits for heat-related illness was highest among Black residents. They visited the ED for heat-related illness at roughly double the rate of Hispanic and White residents and four times the rate of Asian residents. Black King County residents were also overrepresented among ED visits for cold-related illness, along with American Indian and Alaska Native residents.
While there is a lot to learn from these dashboards, it’s also important to note their limitations. Measuring the number of residents visiting the ED or responded to by Emergency Medical Services, for example, does not capture people who may be ill but do not seek medical attention for various reasons — distrust of healthcare providers, lack of insurance, lack of transportation, language barriers, and more. These dashboards also do not represent all of climate change’s impacts on health. For example, there have been serious mental health impacts associated with climate change, especially among young people, but we aren’t able to include that in these dashboards due to a lack of local data.
DATA IS IMPORTANT TO KING COUNTY’S CLIMATE WORK
The climate and health data dashboards are another step in Public Health’s work to center climate change in the agency’s programming, and are one of the action items in the King County 2020-2025 Strategic Climate Action Plan.
Other King County agencies are using data to inform their climate work: A heat mapping project done in 2020 by King County, Seattle Public Utilities, and the City of Seattle showed how local temperatures vary due to differences in land use, tree cover, and geography. Areas with more pavement and fewer trees, for example, get hotter and stay hot for longer. Those results have informed both short-term and long-term actions related to emergency management, public health, land use, urban planning, conservation and more.